Waterfall Build Up Chart in PowerPoint
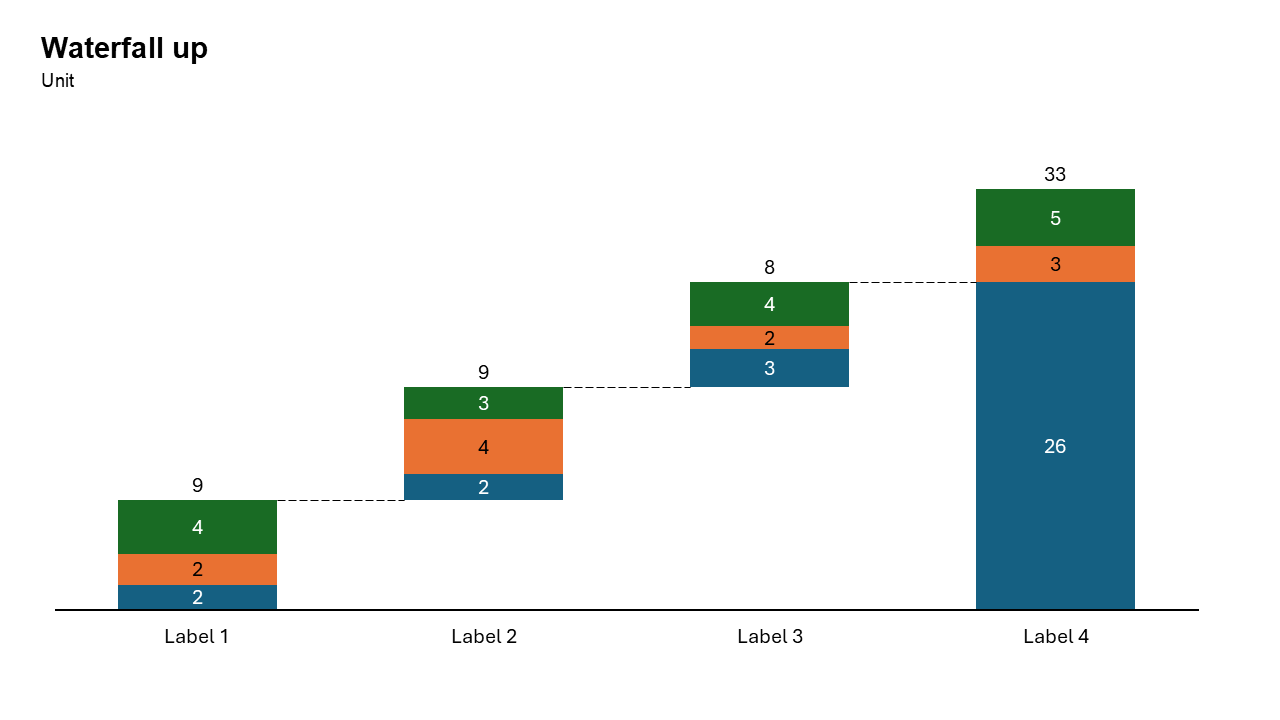
The waterfall up chart is a specialized variation of the traditional waterfall chart, designed to emphasize positive growth over time or across categories. It’s an excellent way to showcase incremental gains and their cumulative effect, helping audiences easily grasp how individual contributions lead to a positive outcome.
With the Slidedoer PowerPoint Add-in, creating waterfall up charts is straightforward, enabling you to highlight success stories and growth metrics effectively. Let’s explore the details and benefits of this chart type.
What is a Waterfall Build Up Chart?
A waterfall up chart visualizes the incremental contributions of positive values, showing how individual components build upon each other to reach a final cumulative total. Unlike a traditional waterfall chart, which may include both gains and losses, the waterfall up chart focuses exclusively on positive growth.
- Tracking revenue growth from different product lines
- Highlighting cumulative milestones achieved in a project
- Showing month-over-month increases in key performance metrics
Why Use It?
Emphasize Positive Growth
By focusing solely on increases, this chart type provides a clear and uplifting narrative of progress.
Illustrate Contributions
Break down total growth into individual components, helping audiences understand how each element contributes to the final result.
Simplify Data Storytelling
By eliminating negative values, the waterfall up chart streamlines the narrative and keeps the focus on success.
Easy to Interpret
The step-by-step visualization makes it easy for viewers to follow how incremental gains lead to the total.
Best Use Cases
- Revenue Growth Breakdown: Show how different product lines or services contribute to overall revenue growth.
- Project Milestones: Visualize how completed tasks or milestones contribute to cumulative project progress.
- Sales Performance: Highlight month-over-month or quarter-over-quarter sales increases across regions or teams.
- Budget Growth: Illustrate how incremental funding allocations lead to a larger total budget.
When to Avoid It
Avoid using this chart if the dataset contains significant negative values, as they are better represented in a standard waterfall chart.
For purely comparative analysis, consider bar charts or clustered bar charts instead.
Tips for Better Charts
- Highlight Key Contributions: Use distinct colors or annotations to emphasize the most significant growth drivers.
- Add a Starting Point: If relevant, include an initial baseline value to show growth from a specific starting point.
- Keep It Simple: Avoid cluttering the chart with too many categories. Focus on the most impactful contributors.
- Label Clearly: Use descriptive labels and data values to ensure clarity for your audience.
- Use Gradual Steps: Arrange data logically to demonstrate a smooth progression toward the total.
Examples of Waterfall Build Up Charts
Revenue Growth by Product Line
Visualize how sales from different product categories contribute to total revenue growth.
Cumulative Project Milestones
Show the incremental achievements of a project, leading to the final milestone.
Monthly Sales Increases
Highlight how monthly sales increases accumulate over the course of a year.
Budget Expansion
Illustrate how successive funding additions lead to the final budget total.
Advantages of Waterfall Build Up Charts
- Focus on Positivity: By excluding losses, the chart maintains a clear focus on growth and success.
- Step-by-Step Clarity: Incremental contributions are visually distinct, making it easy to understand the progression.
- Customizable: With Slidedoer, you can tailor colors, labels, and styles to match your presentation theme.
- Audience-Friendly: Simplifies complex data into a visually engaging story of progress.
Conclusion
The waterfall build up chart is an excellent choice for visualizing positive growth, offering clarity and focus in data storytelling. Whether you’re highlighting revenue growth, project milestones, or cumulative achievements, this chart type helps your audience grasp the story of success.
Related Charts
Waterfall Build Up Chart | | Waterfall Build Down Chart | | Combo Chart | | Error Bar Chart | | Line Chart | | 100% Stacked Mekko Chart | | Stacked Mekko Chart | | Stacked Bar Chart | | Clustered Bar Chart | | 100% Stacked Bar Chart | | Stacked Column Chart | | Clustered Column Chart | | 100% Stacked Column Chart | | 100% Stacked Area Chart | | Stacked Area Chart | | Scatter Plot Chart | | Bubble Chart | | Pie Chart | | Doughnut Chart | | Football Field Chart | | Gantt Chart
Create Better Charts in Seconds
Use Slidedoer PowerPoint Add-in to instantly build professional waterfall build up charts and 45+ business layouts.
Try Slidedoer