Horizontal Stacked Bar Chart in PowerPoint
When it comes to showcasing part-to-whole relationships across multiple categories, the horizontal stacked bar chart is one of the best tools in your data visualization toolkit. It’s especially effective when category names are long, or when you want to compare contributions side by side.
With the Slidedoer PowerPoint Add-in, creating and customizing horizontal stacked bar charts is quick and seamless. Let’s dive into the details of this powerful chart type and how you can use it to enhance your presentations.
What is a Horizontal Stacked Bar Chart?
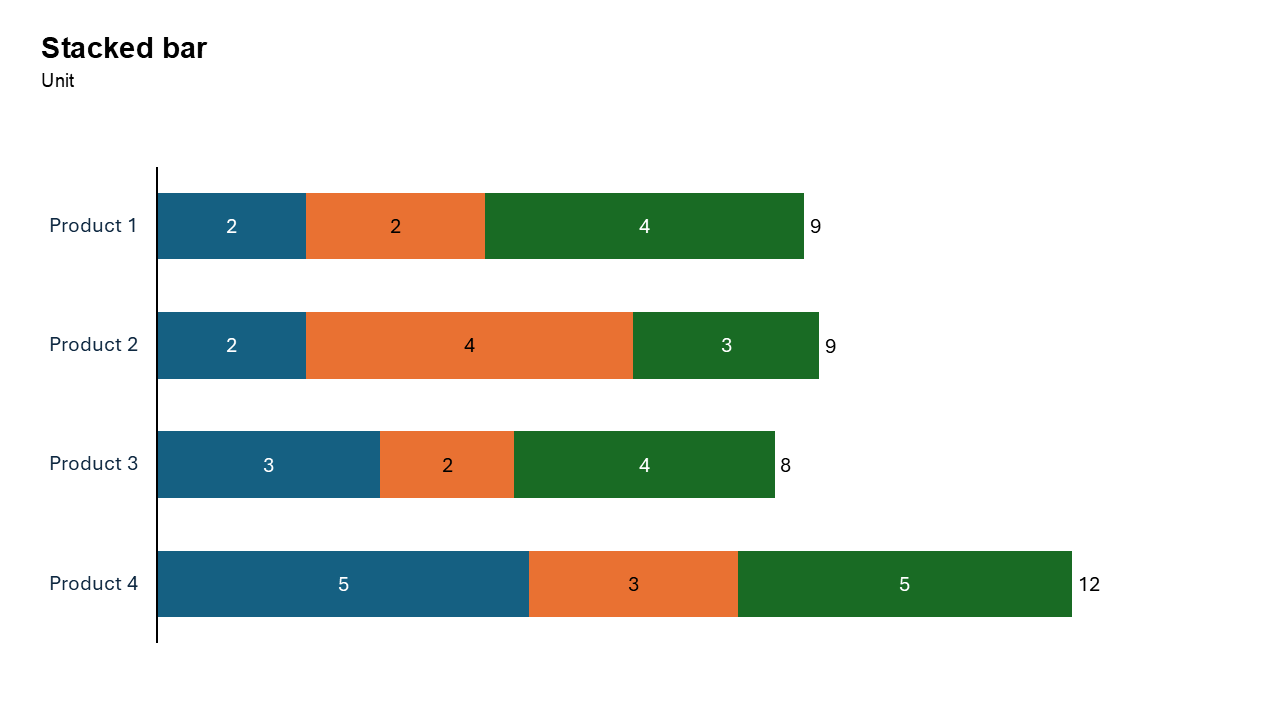
A horizontal stacked bar chart represents data using horizontal bars divided into segments. Each segment represents a part of the whole, and the total length of the bar represents the total value for that category.
- Comparing contributions of individual components within categories.
- Visualizing distributions across multiple groups.
- Highlighting part-to-whole relationships while maintaining a clear layout.
Why Use It?
Handle Long Category Names
The horizontal layout makes it easier to display lengthy category names without crowding the chart.
Show Contributions
Each segment of the bar represents a distinct component, helping you visualize the breakdown of values within a category.
Enable Easy Comparison
The side-by-side arrangement of categories allows for straightforward comparison of totals and segment distributions.
Improve Readability
For certain datasets, horizontal stacked bars provide better readability than vertical stacked bars, especially when comparing multiple categories.
Best Use Cases
- Market Share Analysis: Visualize the contribution of various brands or products within a market.
- Survey Results: Show the percentage breakdown of responses across different categories.
- Resource Allocation: Highlight how budgets or resources are distributed among departments.
- Project Timelines: Display the contribution of tasks or phases to the overall timeline.
When to Avoid It
If the total values are of greater importance than the individual segments, consider a simple horizontal bar chart.
If there are too many categories, the chart may become cluttered. In such cases, consider summarizing the data or using an alternative visualization.
Tips for Better Charts
- Limit the Number of Segments: Too many segments can make the chart hard to interpret.
- Use Consistent Colors: Assign distinct but consistent colors to segments for easy recognition across slides.
- Label Clearly: Add descriptive labels for both the categories and segments to avoid confusion.
- Order Strategically: Arrange categories logically, such as by total value or alphabetically.
- Add Legends and Annotations: Provide a legend to explain segment colors and highlight key insights with annotations.
Examples of Horizontal Stacked Bar Charts
Marketing Campaign Performance
Visualize the contributions of different advertising channels (e.g., social media, email, TV) to total campaign performance across regions.
Budget Allocation
Break down how departmental budgets are spent across various cost categories like salaries, training, and operations.
Employee Survey Results
Show the distribution of employee satisfaction levels (e.g., satisfied, neutral, dissatisfied) across different teams.
Product Sales Distribution
Illustrate the proportion of sales for various product categories within each sales region.
Advantages of Horizontal Stacked Bar Charts
- Clarity with Long Labels: The horizontal layout accommodates detailed category names without compromising readability.
- Visualize Component Contributions: Effectively show how individual parts contribute to the whole.
- Comparison Across Groups: Makes it easy to compare total values and segment distributions across categories.
Conclusion
The horizontal stacked bar chart is a powerful tool for visualizing part-to-whole relationships, especially when dealing with long category names or multiple data segments. Whether you're analyzing survey results, resource allocation, or market share, this chart type offers clarity and precision.
Related Charts
Waterfall Build Up Chart | | Waterfall Build Down Chart | | Combo Chart | | Error Bar Chart | | Line Chart | | 100% Stacked Mekko Chart | | Stacked Mekko Chart | | Stacked Bar Chart | | Clustered Bar Chart | | 100% Stacked Bar Chart | | Stacked Column Chart | | Clustered Column Chart | | 100% Stacked Column Chart | | 100% Stacked Area Chart | | Stacked Area Chart | | Scatter Plot Chart | | Bubble Chart | | Pie Chart | | Doughnut Chart | | Football Field Chart | | Gantt Chart
Create Better Charts in Seconds
Use Slidedoer PowerPoint Add-in to instantly build professional stacked bar charts and 45+ business layouts.
Try Slidedoer