Gantt Chart in PowerPoint
A Gantt chart is one of the most powerful tools for visualizing project timelines, tracking task progress, and managing dependencies. Whether you're handling a business project, product launch, or internal planning, a Gantt chart helps you clearly communicate schedules and milestones.
What is a Gantt Chart?
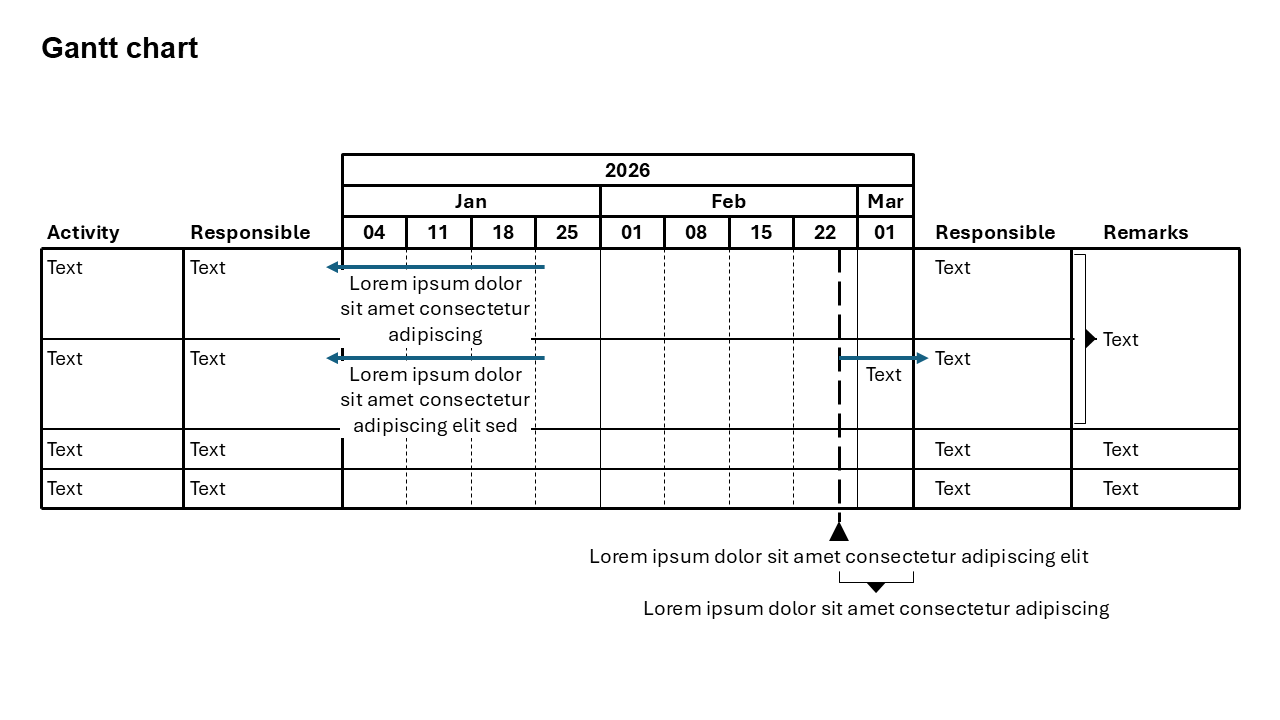
A Gantt chart is a horizontal bar chart used in project management to represent tasks along a timeline. Each bar shows the start and end dates of a task, making it easy to understand scheduling, overlaps, and dependencies.
- Project timelines and milestones
- Task scheduling and duration tracking
- Resource planning and allocation
Why Use a Gantt Chart?
Clear Timeline View
Shows the entire project schedule at a glance.
Task Dependencies
Helps identify which tasks depend on others.
Better Planning
Improves coordination and reduces delays.
Best Use Cases
- Project Management: Track project phases and deadlines.
- Product Launch: Plan marketing, development, and release timelines.
- Construction Planning: Manage multi-stage execution schedules.
When to Avoid It
Avoid using a Gantt chart for very simple tasks or when there are too many small activities, as it can become cluttered. In such cases, a checklist or simple timeline may work better.
Tips for Better Gantt Charts
- Keep Tasks Clear: Break work into meaningful tasks.
- Use Color Coding: Differentiate task categories or teams.
- Highlight Milestones: Mark important deadlines clearly.
- Avoid Overloading: Too many tasks reduce readability.
Examples of Gantt Charts
Software Development
Track design, development, testing, and deployment phases.
Marketing Campaign
Plan content creation, promotions, and campaign timelines.
Event Planning
Organize tasks like venue booking, invitations, and logistics.
Advantages of Gantt Charts
- Improves Visibility: Everyone understands the project timeline.
- Tracks Progress: Easily monitor completed vs pending tasks.
- Enhances Collaboration: Aligns teams on deadlines and dependencies.
Conclusion
A Gantt chart is essential for effective project planning and execution. It simplifies complex timelines, improves team coordination, and ensures that projects stay on track from start to finish.
Related Charts
Waterfall Build Up Chart | | Waterfall Build Down Chart | | Combo Chart | | Error Bar Chart | | Line Chart | | 100% Stacked Mekko Chart | | Stacked Mekko Chart | | Stacked Bar Chart | | Clustered Bar Chart | | 100% Stacked Bar Chart | | Stacked Column Chart | | Clustered Column Chart | | 100% Stacked Column Chart | | 100% Stacked Area Chart | | Stacked Area Chart | | Scatter Plot Chart | | Bubble Chart | | Pie Chart | | Doughnut Chart | | Football Field Chart | | Gantt Chart
Create Gantt Charts in Seconds
Use Slidedoer PowerPoint Add-in to instantly build professional Gantt charts and 60+ business layouts.
Try Slidedoer