Football field Chart in PowerPoint
When it comes to showcasing ranges, comparisons, or valuation estimates in a visually compelling and easy-to-interpret format, the football field chart is a game-changer. Commonly used in financial presentations, this chart type is ideal for summarizing data in a concise, visually engaging manner.
With the Slidedoer PowerPoint Add-in, creating professional football field charts is quick and effortless, ensuring your presentations are both informative and impactful. Let’s explore how this chart type works, its advantages, and when to use it
What is a Football Field Chart?
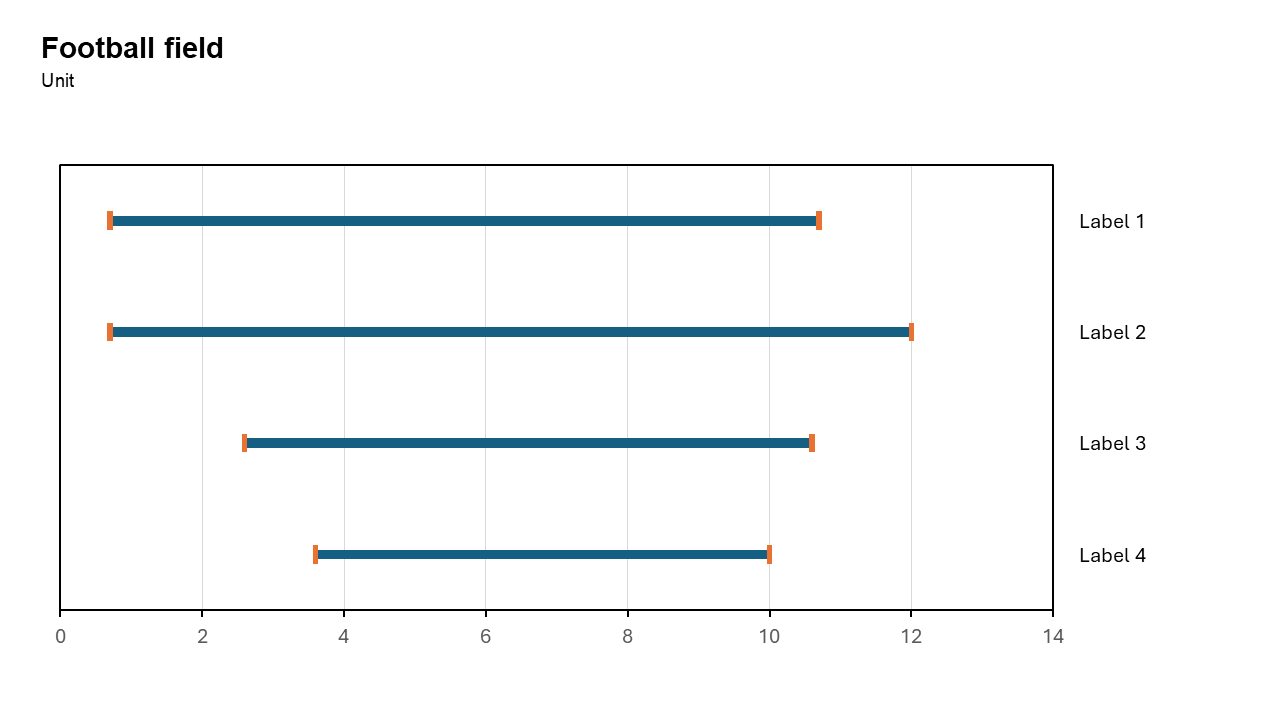
A football field chart is a horizontal bar chart that displays a range of values for multiple categories. Its primary purpose is to show comparisons across different metrics or scenarios, making it especially popular in financial analysis, valuations, and benchmarking.
Each "range" in the chart is represented by a horizontal bar, visually resembling the markings on a football field, which is where the name originates.
- Comparing valuation ranges for a business (e.g., DCF, Comparable Companies, Precedent Transactions).
- Benchmarking performance metrics like revenue growth, profit margins, or market share.
Why Use It?
Visualize Data Ranges
Football field charts make it easy to compare ranges of values, such as minimum, maximum, and median estimates.
Simplify Complex Information
This chart type condenses large amounts of data into a clear, visually appealing format.
Highlight Key Insights
By showcasing overlaps, gaps, or outliers, football field charts emphasize critical takeaways.
Professional Appeal
Widely used in corporate and financial settings, football field charts add a polished, analytical look to your presentations.
Best Use Cases
- Financial Valuations: Compare valuation ranges derived from different methods (e.g., DCF, market comparables).
- Performance Benchmarks: Showcase revenue, profitability, or market share across industry peers.
- Scenario Analysis: Present best-case, worst-case, and base-case projections for business strategies.
- Project Metrics: Highlight cost ranges, timelines, or resource allocations for various initiatives.
When to Avoid It
Avoid using football field charts for data that requires precise individual values, as this chart type emphasizes ranges over exact numbers. If the dataset includes too many categories, consider simplifying it to maintain clarity.
Tips for Better Charts
- Use Distinct Colors: Assign unique colors or shades to each category to avoid confusion.
- Highlight Critical Ranges: Use annotations or bold colors to draw attention to important insights.
- Include Markers: Add markers for median or target values to provide additional context.
- Maintain Simplicity: Avoid overcrowding the chart with too many ranges or excessive labels.
- Provide Context: Include a title, legend, and brief explanation to ensure the audience understands the data.
Examples of Football Field Charts
Business Valuation
Compare valuation ranges for a company using methods like discounted cash flow (DCF), precedent transactions, and market comparables.
Industry Benchmarking
Show performance ranges for competitors across metrics such as revenue, EBITDA, and profit margins.
Strategic Scenarios
Present potential outcomes for a new business initiative, including best-case, worst-case, and expected scenarios.
Advantages of Football Field Charts
- Comprehensive Comparisons: Displays multiple ranges side by side for easy comparisons.
- Enhanced Visual Impact: Clean, professional design captures attention and communicates insights effectively.
- Versatile Applications: Suitable for financial, strategic, and operational analyses.
- Customizable : Easily adjust colors, labels, and formatting to suit your needs.
Conclusion
The football field chart is an essential tool for presenting comparative ranges and showcasing insights in a professional, visually appealing way. Whether you're analyzing valuations, benchmarking performance, or conducting scenario analyses, this chart type helps you communicate data with clarity and impact.
Related Charts
Waterfall Build Up Chart | | Waterfall Build Down Chart | | Combo Chart | | Error Bar Chart | | Line Chart | | 100% Stacked Mekko Chart | | Stacked Mekko Chart | | Stacked Bar Chart | | Clustered Bar Chart | | 100% Stacked Bar Chart | | Stacked Column Chart | | Clustered Column Chart | | 100% Stacked Column Chart | | 100% Stacked Area Chart | | Stacked Area Chart | | Scatter Plot Chart | | Bubble Chart | | Pie Chart | | Doughnut Chart | | Football Field Chart | | Gantt Chart
Create Better Charts in Seconds
Use Slidedoer PowerPoint Add-in to instantly build professional football field charts and 60+ business layouts.
Try Slidedoer