Vertical Clustered Column Chart in PowerPoint
When your goal is to compare multiple data points across different categories, the clustered column chart is one of the most effective tools in your visualization arsenal. This chart type allows for straightforward comparisons and makes identifying patterns or trends easy.
With the Slidedoer PowerPoint Add-in, creating and customizing clustered column charts is fast and effortless, enabling you to deliver professional, high-impact presentations. Let’s explore what makes this chart type unique, its applications, and how to use Slidedoer to create one.
What is a Vertical Clustered Column Chart?
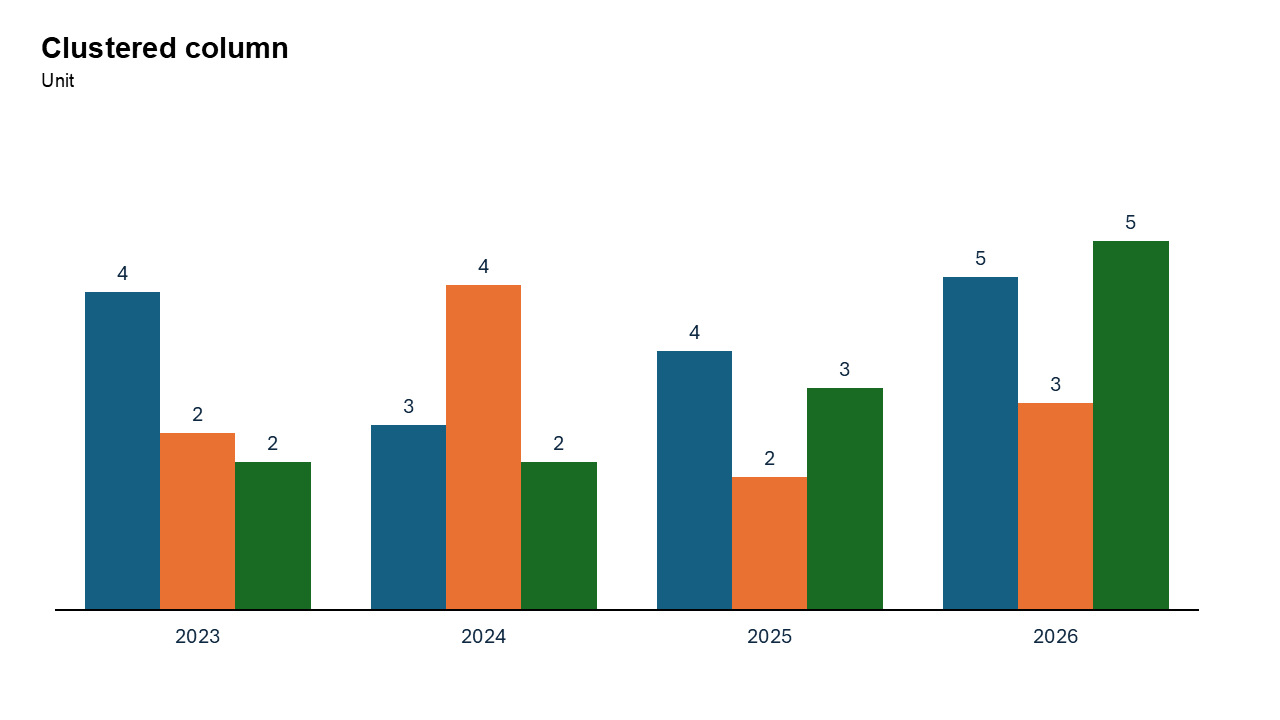
A clustered column chart displays data using vertical bars grouped together (or "clustered") by category. Each group represents a single category on the X-axis, with each bar in the group showing a different data series.
- Comparing monthly sales for different product lines.
- Analyzing survey results across multiple demographics.
Why Use It?
Clear Comparisons
Clustered column charts make it easy to compare data across categories and within each group.
Visualize Multiple Data Series
They allow for simultaneous comparisons of different data series across categories.
Spot Patterns and Trends
By grouping data, these charts highlight relationships and trends within and between categories.
Professional and Versatile
Clustered column charts are widely used in business, education, and research settings for their simplicity and effectiveness.
Best Use Cases
- Sales Performance: Compare monthly or quarterly sales across product lines.
- Survey Results: Visualize responses to survey questions segmented by demographics.
- Performance Metrics: Analyze employee performance across departments or teams.
- Resource Allocation: Compare budgets or resource allocations across projects.
When to Avoid It
Avoid clustered column charts if you have too many data series or categories, as the chart can become cluttered. If proportions are more important than absolute values, consider using a 100% stacked column chart instead.
Tips for Better Charts
- Use Distinct Colors: Assign unique colors to each data series for clear differentiation.
- Add Data Labels: Label key values to improve readability and interpretation.
- Limit the Number of Clusters: Focus on the most relevant categories to maintain clarity.
- Provide Context: Include a descriptive title, axis labels, and a legend to ensure the chart is self-explanatory.
- Highlight Key Insights: Use bold colors or annotations to emphasize important trends or patterns.
Examples of Vertical Clustered Column Charts
Monthly Sales by Product Line
Illustrate sales performance for multiple product lines across months.
Survey Responses by Age Group
Compare survey responses (e.g., satisfaction ratings) across different age groups.
Revenue by Region
Highlight revenue contributions from different regions for each quarter.
Expense Comparison
Visualize expenses across categories (e.g., marketing, operations, R&D) for multiple departments.
Advantages of Vertical Clustered Column Charts
- Simple Comparisons: Ideal for side-by-side comparisons of data across categories.
- Highlight Patterns: Effectively reveals trends and relationships within grouped data.
- Customizable with Slidedoer: Easily adjust colors, labels, and formatting to suit your presentation needs.
- Widely Applicable: Suitable for business, academic, and research presentations.
Conclusion
The vertical clustered column chart is a powerful and versatile tool for comparing data across multiple categories. Whether you're analyzing sales performance, survey results, or budget allocations, this chart type helps you communicate insights clearly and effectively.
Related Charts
Waterfall Build Up Chart | | Waterfall Build Down Chart | | Combo Chart | | Error Bar Chart | | Line Chart | | 100% Stacked Mekko Chart | | Stacked Mekko Chart | | Stacked Bar Chart | | Clustered Bar Chart | | 100% Stacked Bar Chart | | Stacked Column Chart | | Clustered Column Chart | | 100% Stacked Column Chart | | 100% Stacked Area Chart | | Stacked Area Chart | | Scatter Plot Chart | | Bubble Chart | | Pie Chart | | Doughnut Chart | | Football Field Chart | | Gantt Chart
Create Better Charts in Seconds
Use Slidedoer PowerPoint Add-in to instantly build professional clustered column charts and 45+ business layouts.
Try Slidedoer