Profit and Loss Slide in PowerPoint
Financial performance is one of the most important indicators of business success. Executives, investors, finance teams, consultants, and business leaders regularly present revenue, expenses, profits, and financial trends to support strategic decision-making. A Profit and Loss Slide provides a clear visual summary of an organization's financial health and operating performance.
With the Slidedoer PowerPoint Add-in, you can instantly create professional Profit and Loss Slides that help stakeholders quickly understand business results, profitability trends, cost structures, and financial performance. Whether you're preparing board presentations, investor reports, monthly business reviews, budget discussions, or annual financial summaries, P&L slides simplify complex financial information into an easy-to-understand format.
What is a Profit and Loss Slide?
A Profit and Loss (P&L) Slide is a financial presentation framework used to summarize an organization's revenues, costs, expenses, and profits over a specific period. It visually communicates financial performance and helps stakeholders evaluate profitability and business sustainability.
- Revenue performance.
- Operating expenses.
- Gross profit and net profit.
- Cost structure analysis.
- Financial trends and business performance.
Why Use It?
Provides Financial Clarity
Summarizes complex financial data into a concise and executive-friendly visual format.
Supports Better Decisions
Enables leaders to evaluate profitability, cost management, and growth opportunities.
Improves Stakeholder Communication
Helps investors, executives, and teams quickly understand business performance.
Tracks Business Performance
Allows organizations to monitor trends and compare actual results against targets.
Best Use Cases
- Board Meetings: Presenting quarterly and annual business performance.
- Investor Reports: Demonstrating profitability and financial growth.
- Monthly Business Reviews: Tracking revenue and expense trends.
- Budget Planning: Comparing forecasts against actual performance.
- Startup Financial Presentations: Showing financial traction and scalability.
Key Components of a Profit and Loss Statement
Revenue
The total income generated from sales of products or services before expenses are deducted.
Cost of Goods Sold (COGS)
Direct costs associated with producing goods or delivering services.
Gross Profit
Calculated as Revenue minus COGS. Indicates the profitability of core business operations.
Operating Expenses
Expenses related to running the business, including salaries, marketing, rent, and administration.
Net Profit
The final profit remaining after all expenses, taxes, and interest have been deducted.
When to Avoid It
Avoid using a Profit and Loss Slide when presenting operational workflows, organizational structures, project timelines, or strategic roadmaps. Financial performance slides are specifically designed to communicate financial results rather than operational execution.
Tips for Better Profit and Loss Slides
- Highlight Key Metrics: Emphasize revenue, gross margin, EBITDA, and net profit.
- Use Visual Charts: Include waterfall charts, bar charts, or trend lines for better understanding.
- Compare Periods: Show year-over-year or month-over-month performance.
- Explain Variances: Clearly describe significant changes in revenue or expenses.
- Keep It Executive-Friendly: Focus on insights rather than overwhelming audiences with raw financial data.
Examples of Profit and Loss Slides
Quarterly Financial Review
Revenue, operating expenses, EBITDA, and net income comparison across quarters.
Startup Investor Update
Monthly recurring revenue, customer acquisition costs, burn rate, and profitability trends.
Department Financial Performance
Budget allocation, actual spending, and cost variance analysis by department.
Annual Business Performance Report
Year-over-year revenue growth, operating margins, and profitability analysis.
Advantages of Profit and Loss Slides
- Improves Financial Visibility: Provides a clear picture of business performance.
- Supports Strategic Planning: Enables data-driven business decisions.
- Enhances Stakeholder Confidence: Demonstrates financial transparency.
- Identifies Profitability Trends: Highlights areas requiring improvement.
- Widely Used Across Industries: Suitable for startups, enterprises, and nonprofit organizations.
Common Profit and Loss Slide Formats
- Summary P&L Table: Presents major financial metrics in tabular form.
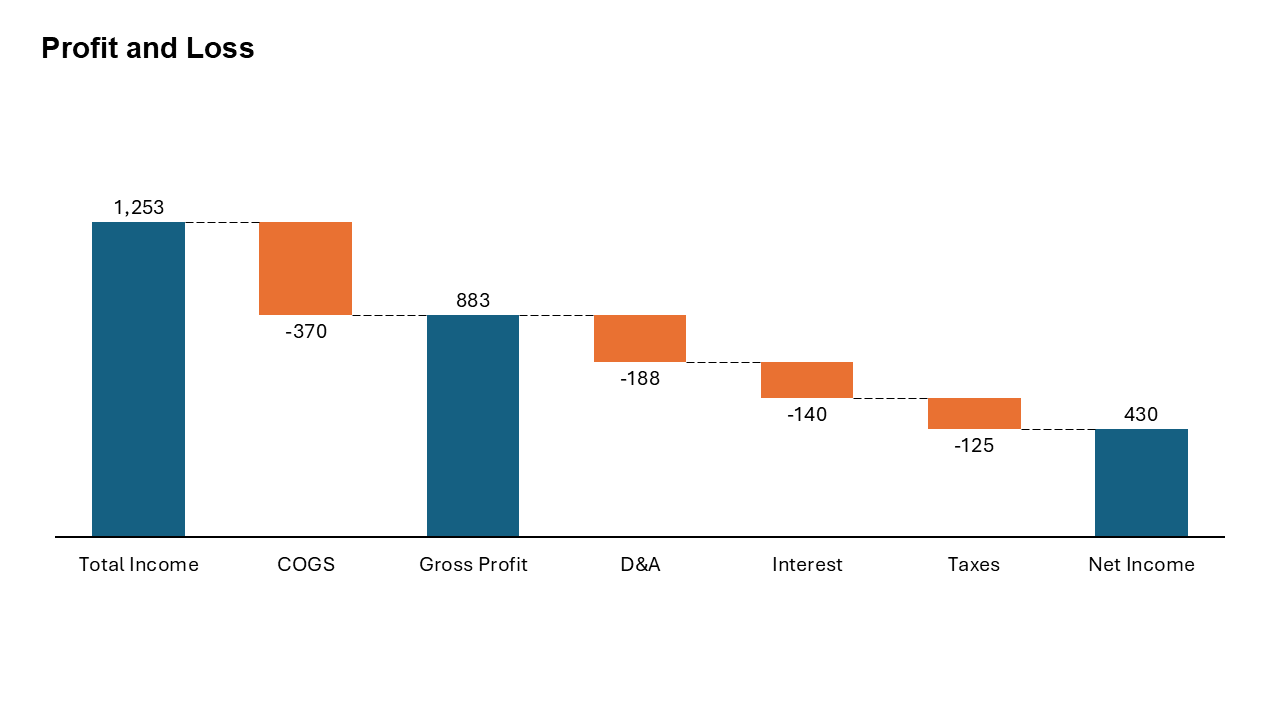
- Waterfall Chart: Visualizes how revenue converts into profit.
- Trend Analysis Chart: Shows financial performance over time.
- Variance Analysis Slide: Compares actual versus budgeted results.
- Margin Analysis Slide: Displays gross, operating, and net profit margins.
- Segment Performance Slide: Compares profitability across business units or regions.
Profit and Loss Slide vs Cash Flow Slide
Although both are important financial reporting tools, they answer different business questions.
- Profit and Loss Slide: Measures profitability over a specific period.
- Cash Flow Slide: Tracks the movement of cash into and out of the business.
- Profit and Loss Slide: Focuses on revenues and expenses.
- Cash Flow Slide: Focuses on liquidity and cash availability.
- Profit and Loss Slide: Indicates whether a business is profitable.
- Cash Flow Slide: Indicates whether a business has sufficient cash to operate.
How to Present Financial Results Effectively
Effective financial presentations go beyond simply showing numbers. Start by highlighting the most important performance indicators, such as revenue growth, profit margins, and major cost drivers. Focus on the business story behind the numbers.
Use charts and visual summaries to emphasize trends, explain significant variances, and communicate business impact. Whenever possible, compare actual performance with budgets, forecasts, or previous periods to provide context.
For executive audiences, summarize key insights, risks, and recommended actions rather than presenting excessive detail. A concise, visually appealing Profit and Loss Slide can significantly improve stakeholder engagement and decision-making.
Conclusion
The Profit and Loss Slide is an essential business presentation tool for communicating financial performance, profitability, and business health. By presenting revenues, expenses, and profit metrics in a clear visual format, organizations can support informed decision-making, improve financial transparency, and align stakeholders around business performance goals.
Related Slides
Circular Flow | | Linear Process Flow | | Filter | | Fish Bone | | Funnel | | Market Size | | Pillar | | Pyramid | | Roadmap | | Steps | | SWOT | | P&L | | Chart | |
Create Professional Profit and Loss Slides in Seconds
Use Slidedoer PowerPoint Add-in to instantly build Profit and Loss statements, financial dashboards, revenue analysis slides, waterfall charts, and 60+ business presentation layouts.
Try Slidedoer