Fishbone Slide in PowerPoint
When organizations face recurring problems, project delays, quality issues, customer complaints, or operational inefficiencies, identifying the true root cause is critical. A Fishbone Slide, also known as an Ishikawa Diagram or Cause-and-Effect Diagram, provides a structured way to explore potential causes and understand the factors contributing to a problem.
With the Slidedoer PowerPoint Add-in, you can instantly create professional Fishbone Slides that help teams perform root cause analysis, facilitate brainstorming sessions, improve quality management, and communicate problem-solving frameworks effectively. Fishbone diagrams are widely used in consulting, manufacturing, healthcare, IT, project management, and business operations.
What is a Fishbone Slide?
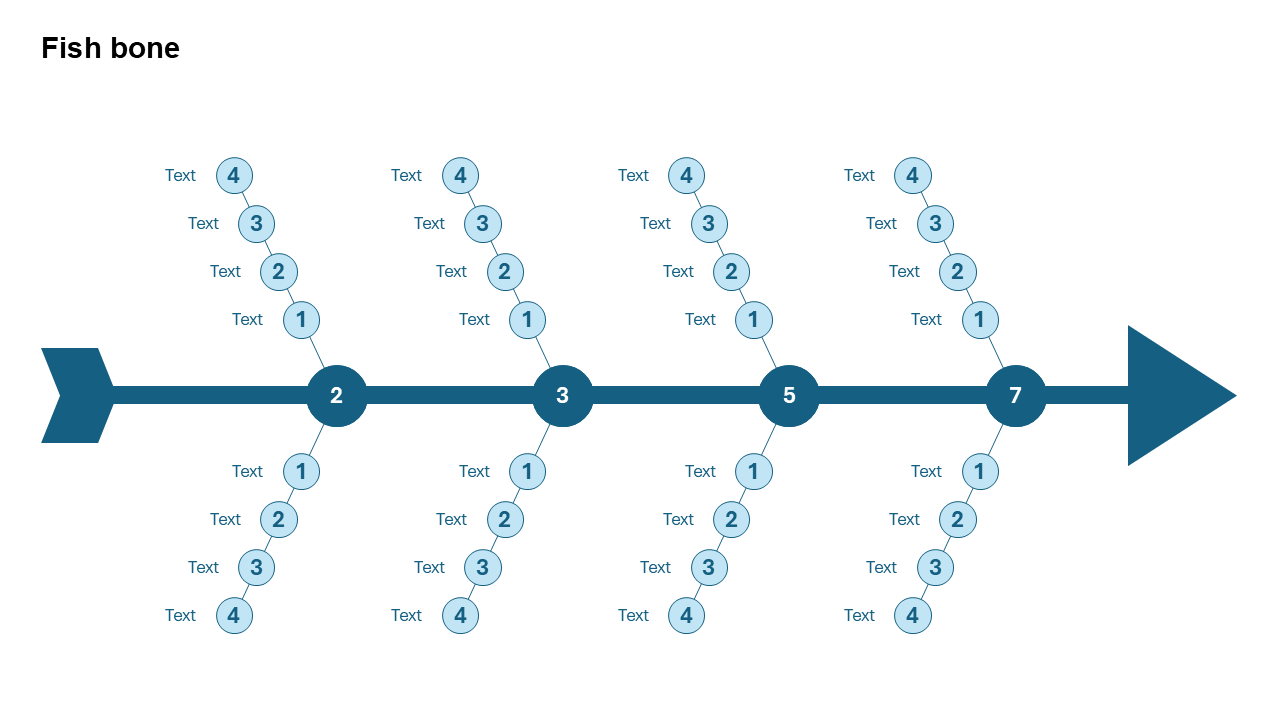
A Fishbone Slide is a visual problem-solving framework that helps identify and categorize potential causes of a specific issue. The diagram resembles a fish skeleton, where the problem is placed at the head and contributing causes branch off from the main spine.
- Root cause analysis.
- Quality improvement initiatives.
- Operational problem solving.
- Risk assessment and mitigation.
- Continuous improvement programs.
Why Use It?
Identifies Root Causes
Moves teams beyond symptoms and helps uncover the underlying causes of business problems.
Encourages Structured Thinking
Provides a systematic framework for brainstorming and evaluating contributing factors.
Improves Collaboration
Allows cross-functional teams to contribute ideas and perspectives during problem-solving sessions.
Supports Better Decisions
Helps organizations focus improvement efforts on the most impactful causes.
Best Use Cases
- Quality Management: Identifying causes of product defects and process failures.
- Customer Experience: Investigating customer complaints and service issues.
- Project Management: Analyzing delays, budget overruns, and execution challenges.
- Operations Improvement: Finding causes of inefficiencies and bottlenecks.
- Risk Management: Evaluating factors that contribute to operational or strategic risks.
Common Fishbone Categories
Most Fishbone Diagrams group causes into major categories to ensure comprehensive analysis.
- People: Skills, training, communication, staffing, and performance.
- Process: Procedures, workflows, standards, and controls.
- Technology: Systems, tools, equipment, and software.
- Materials: Inputs, resources, supplies, and inventory.
- Environment: Workplace conditions, regulations, and external factors.
- Measurement: KPIs, reporting, monitoring, and data quality.
When to Avoid It
Avoid using a Fishbone Slide when the objective is to show timelines, workflows, organizational structures, or strategic roadmaps. Fishbone diagrams are specifically designed for root cause analysis rather than process visualization or project planning.
Tips for Better Fishbone Slides
- Clearly Define the Problem: Place a concise problem statement at the head of the fishbone.
- Use Logical Categories: Group causes into meaningful business categories.
- Focus on Root Causes: Avoid listing symptoms as causes.
- Involve Multiple Stakeholders: Gather diverse perspectives during brainstorming.
- Validate Findings: Use data and evidence to confirm suspected causes.
Examples of Fishbone Slides
Customer Satisfaction Issue
Analyze causes related to service quality, response times, staffing, technology, and communication.
Project Delay Analysis
Identify contributing factors such as scope changes, resource shortages, planning gaps, and dependencies.
Manufacturing Defect Investigation
Evaluate causes involving materials, equipment, processes, workforce, and quality controls.
Sales Performance Decline
Examine factors such as market conditions, pricing, customer demand, sales skills, and competition.
Advantages of Fishbone Slides
- Improves Root Cause Identification: Encourages deeper problem analysis.
- Promotes Structured Brainstorming: Organizes causes logically.
- Enhances Team Collaboration: Brings multiple perspectives together.
- Supports Continuous Improvement: Helps prevent recurring issues.
- Widely Recognized Framework: Used across industries worldwide.
Fishbone Diagram vs 5 Whys Analysis
Both Fishbone Diagrams and 5 Whys Analysis are popular root cause analysis techniques, but they serve different purposes.
- Fishbone Diagram: Identifies multiple possible causes across categories.
- 5 Whys: Investigates a single causal chain by repeatedly asking "Why?".
- Fishbone Diagram: Best for brainstorming and group analysis.
- 5 Whys: Best for drilling down into a specific issue.
- Fishbone Diagram: Provides a comprehensive visual overview.
- 5 Whys: Provides deeper insight into one root cause path.
Conclusion
The Fishbone Slide is one of the most effective business presentation tools for root cause analysis and structured problem solving. By organizing potential causes into logical categories, teams can better understand complex issues, prioritize corrective actions, and drive continuous improvement across projects, operations, products, and customer experiences.
Related Slides
Circular Flow | | Linear Process Flow | | Filter | | Fish Bone | | Funnel | | Market Size | | Pillar | | Pyramid | | Roadmap | | Steps | | Chart | |
Create Professional Fishbone Slides in Seconds
Use Slidedoer PowerPoint Add-in to instantly build Fishbone Diagrams, root cause analysis frameworks, problem-solving templates, quality improvement slides, and 60+ business presentation layouts.
Try Slidedoer